
Dijkstra's algorithm
 to
all the other nodes of a graph. We work with a weighted
undirected graph
to
all the other nodes of a graph. We work with a weighted
undirected graph ") ,
where
,
where  is a set of nodes,
  is a set of undirected edges
and
is a set of undirected edges
and  is a weight of
any edge. At the beginning of the algorithm we
add the value "
is a weight of
any edge. At the beginning of the algorithm we
add the value " " to the
label of the initial node
" to the
label of the initial node  "
to labels of all the other nodes
"
to labels of all the other nodes 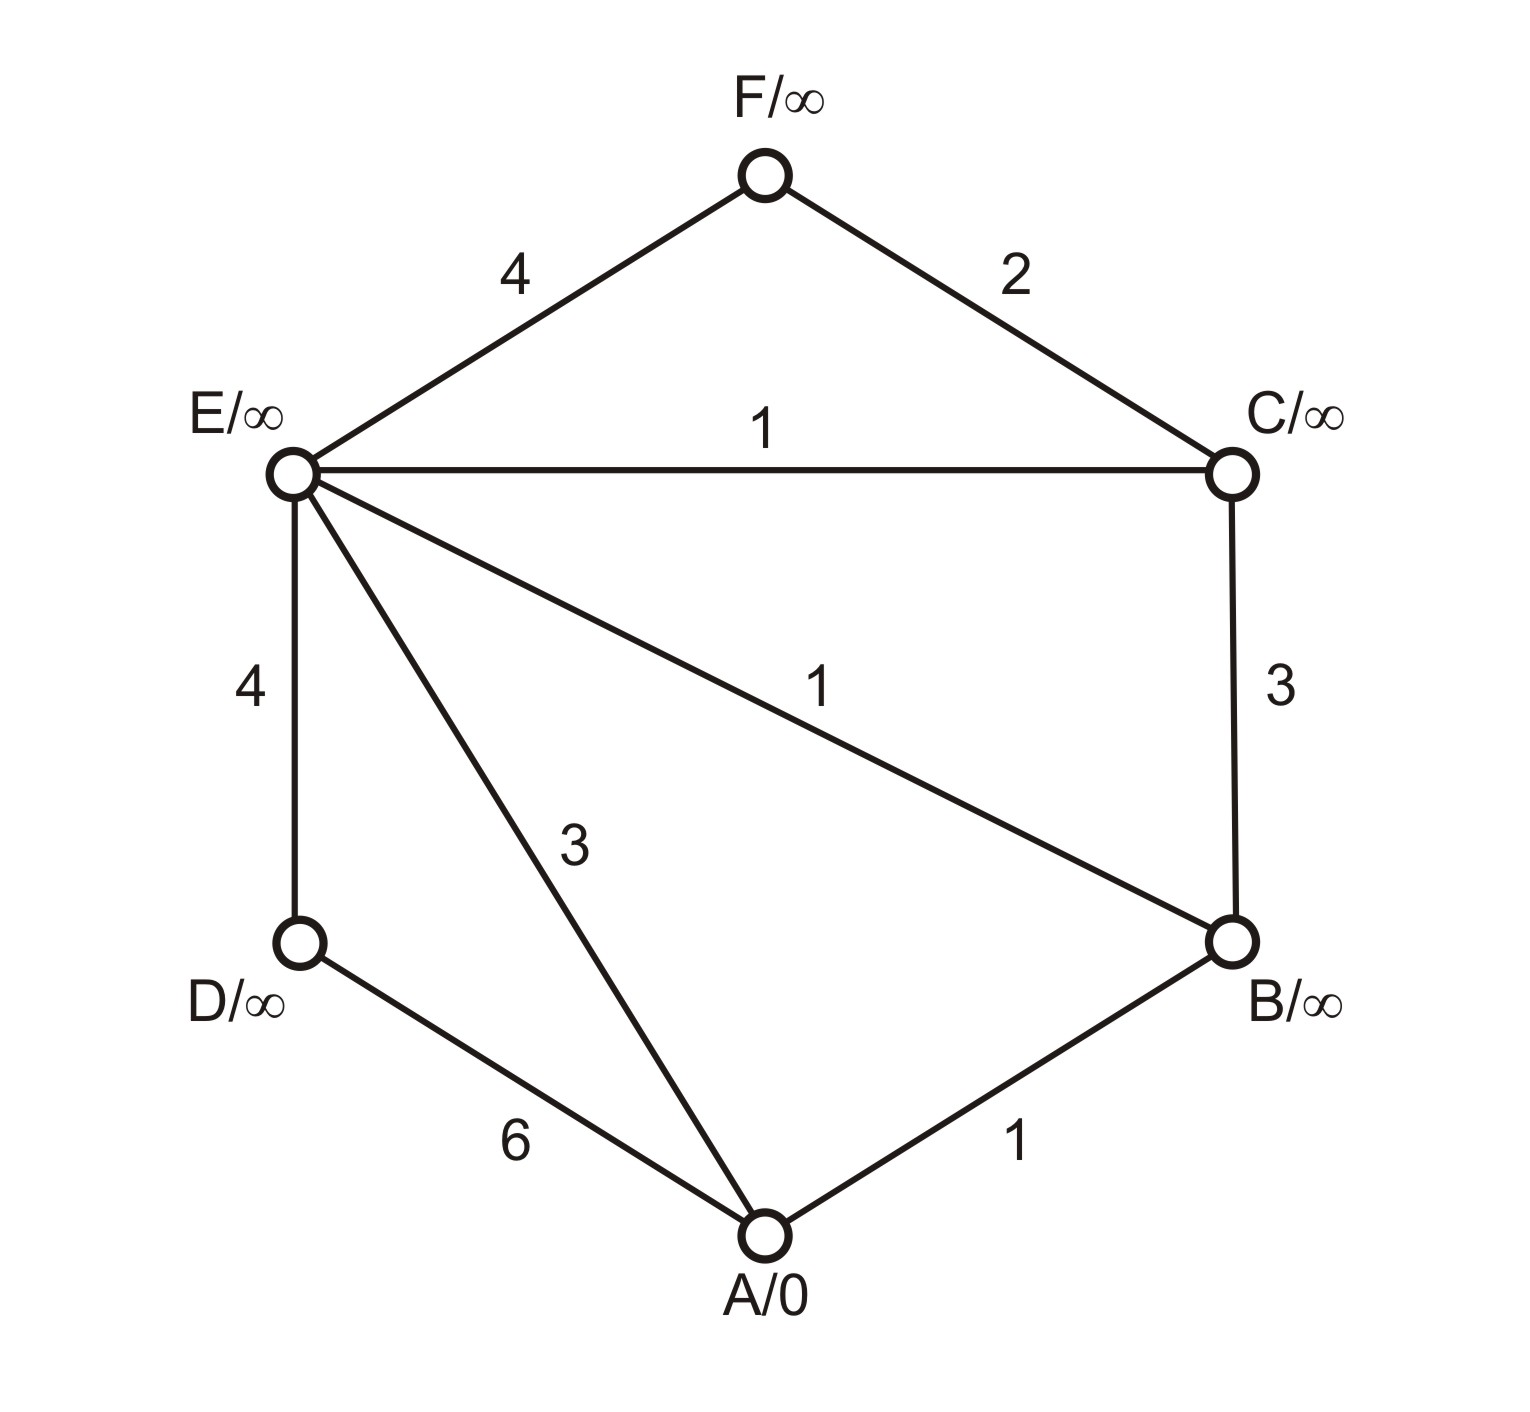
 " with
the smallest tentative distance
" with
the smallest tentative distance  coming out from
the node "
coming out from
the node " ":
":
") , modify the current tentative
distance of the
node
, modify the current tentative
distance of the
node ") ,
,


 –
–
 –
–
 –
– –
–
 –
– –
–
 –
– –
– –
– –
–2. Proposals of adaptation
1. Work with a graph on a sheet of a spreadsheet:
We add labels of all the nodes to the first column starting
with the initial node. All the other cells on the row
for a node  are reserved for edges coming out from and
are written as
are reserved for edges coming out from and
are written as  –
– where is a weight of the edge and is
the end node of the edge, see Table 1.
where is a weight of the edge and is
the end node of the edge, see Table 1.
Example 3: Table representation of the graph  from Image 1
We modify labels of the nodes in the first column, values of the other columns are to be read only. We mark visited nodes by asterisk to avoid proceeding them in the following steps of the algorithm. We finish the algorithm when all the nodes are marked by asterisk (they are all visited).
2. Work with a graph on two sheets of a spreadsheet:
There is only one change in comparison with the first method of adaptation. We use the first sheet to explore edges whereas the second sheet includes only one column with the nodes' labels to be consecutively modified.
3. Work with a tactile version of a graph, use of any editor to modify tentative distances of nodes:
The method is similar to the previous one and differs only in representation of the graph which is offered as a tactile image. A student combines tactile reading of the graph with editing labels of nodes written in any text editor or spreadsheet.